Recent publications

Journal Article

CASA working paper/ Research briefing notes

This working paper has been published in Environment and Planning B: Urban Analytics and City Science.

This working paper has been published in Geographical Analysis.

Data repository

Reproducible work

Conference


Bin’s favourite study sources

Data Scientist skills

  1. A Learning Path To Becoming a Data Scientist
  2. R powered web applications with Shiny (a tutorial and cheat sheet with 40 example apps)
  3. Data Professor: Free Data Science Courses
  4. Modelling Count Data in A Multilevel Framework
  5. How to create Chord Diagram using R | Data Science
  6. Add image & graph popups as tooltips
  7. R: animation map
  8. Using ggfx for good
  9. A ggplot2 Tutorial for Beautiful Plotting in R
  10. Introduction to social network analysis with R
  11. Animating Your Data Visualizations Like a Boss Using R
  12. DPLYR TUTORIAL : DATA MANIPULATION (50 EXAMPLES)
  13. Data Visualization with R
  14. A Detailed Guide to ggplot colors
  15. Hybrid hierarchical k-means clustering
  16. England and Wales commute data
  17. Some of the best data visualisation content encountered during December 2019
  18. 5 ways to measure running time of R code
  19. An animation of the public transport network
  20. Spatial data science for sustainable development 
  21. spatial optimization


English

  1. Learn English with Gill (engVid)
  2. BBC Learning English
  3. Learn English with Emma (engVid)
  4. Learn English with Rebecca (engVid)

Articles

  1. A Multilevel Analysis of the Variations in Domestic Property Prices: Southern England, 1980–87
  2. Multi-Level Models for Geographical Research
  3. Specifying and Estimating Multi-Level Models for Geographical Research
  4. Why geography matters
  5. Recent Empirical Work on the Determinants of Relative House Prices
  6. Standards in housing design: A review of the main changes since the Parker Morris report (1961)

Training course

  1. Statistics for Researchers Workshop, UCL
  2. Multilevel Models: Practical Applications,
  3. Multilevel Modelling, RSS
  4. An introduction to spatio-temporal modelling of small-area data in R
  5. Using UK data portals to find and evaluate data for social science research
  6. Introduction to Spatial Interaction Modelling, NCRM
  7. Interactive Visualisation in R, RSS
  8. Big Data: tools and statistical methods, NCRM
  9. Computational Methods for Social Data Science: Exploring Society through Visualization and Modelling
  10. Spatial Econometrics

Interesting tweet

(1) PhD research

  1. Planning and Housing Landscape Review – Executive Summary
  2. Market Commentary – 2020 Review
  3. Interest rates and Bank Rate
  4. The space standard in Overcrowded housing(England)
  5. OECD-modified scale
  6. What is multilevel modelling? by Professor Kelvyn Jones
  7. 527 swimming pools built in London
  8. Bringing together housing, land and planning geospatial datasets
  9. Housing Affordability Calculator
  10. Rail fares: Commuters ‘pay fifth of salary’ on season ticket
  11. Applying Spatial Analysis to Real Estate Decision-Making
  12. The Role of Data Science in Real Estate
  13. Together at last – UK’s planning and housing statistics now in one place
  14. How far is too far? The distance workers commute to cities – mapped
  15. London’s most affordable commuter towns
  16. Our guide to house price growth vs commute cost
  17. Average London House Price vs London Commuters by Workplace
  18. Why should I commute to work and move out of London?
  19. Big house price savings if you’re prepared to commute
  20. House prices in commuter towns around London substantially cheaper
  21. What benefits are there for London commuters moving to Surrey?
  22. London’s commuter towns More than just house prices and travel times
  23. Long-distance London commuters push up local house prices
  24. Housing crisis: Where are the most new homes being built?
  25. City Definition
  26. Admin-based statistics for property floor space, feasibility research: England and Wales
  27. Help Shape Our Future:The 2021 Census of Population and Housing
  28. About the size of a London flat
  29. Address matching: Machine learning innovations in address matching: A practical comparison of word2vec and CRFs
  30. London Commuter Belt (East)/M11 Sub-Region Strategic Housing Market Assessment 2008
  31. The 10 cheapest commuter towns within an hour from central London
  32. Britain’s new towns
  33. Derbyshire becomes a house price hotspot – and it’s all because of London
  34. The English New Towns since 1946
  35. the 31 hotspots where house prices will surge now
  36. Oxford vs Cambridge: House price rises in UK’s least affordable cities


(2) R

  1. ggraph – exploring flows
  2. Create geographic flow maps : FlowMap.Blue
  3. Global Migrant Stock Chord Diagrams
  4. Travel flows
  5. COVID_Cases_By_Age
  6. FiveThirtyEight
  7. Difference between subset and filter from dplyr
  8. 5 Ways to Subset a Data Frame in R
  9. officer R package
  10. Tidyexplain: Tidy Animated Verbs
  11. Beginners guide to Highchart Visual in R
  12. htmlwidgets for R
  13. Interactive plots with ggiraph
  14. xAxis | highcharts API Reference
  15. Single-Page Reference | R | Plotly
  16. layout | R | Plotly
  17. RStudio Cheatsheets

(3) Other

  1. Bivariate Choropleth Maps: A How-to Guide
  2. Affordable housing monitoring
  3. Where are the largest cities in Britain? 
  4. BBC Briefing on housing
  5. Local housing supply by postcode
  6. Where are all the UK’s new homes being built?
  7. Bus/tram/metro stops in GB
  8. The 50 Richest Women in 2021
  9. Journey times to assess equity of access to services in England.
  10. A chord diagram of travel to work flows in Inner London
  11. The interrelationships between all scientific disciplines
  12. Vaccinations sites in England
  13. Median Council Tax bands in England and Wales
  14. Milton Keynes growth mapped by the year the postcode was introduced 1980-2020
  15. INSPIRE Index Polygons in the West Bridgford area
  16. Motorways and A roads of GB
  17. New open building and population density datasets
  18. Nighttime lights
  19. Potential land constraints
  20. pavement widths
  21. Green spaces in residential gardens
  22. Care homes locations
  23. Retail Catchment Flows from Geolytix
  24. Open data of UK Supermarket Retail Points (Geolytix)
  25. Two thirds of UK homes ‘fail on energy efficiency targets’
  26. Where are the UK’s youngest and oldest city populations?
  27. Raw number of airbnb listings in each area
  28. Commute data in England and Wales (Alasdair Rae)
  29. A new analysis of the extent of short-term and holiday letting services (including but not limited to Airbnb) in London
  30. Over one in five people in the UK live in poverty

On-line books

  1. Urban Informatics
  2. Mastering Software Development in R
  3. R Markdown: The Definitive Guide
  4. Big Book of R
  5. Systems approaches to social, economic and geographic research
  6. Spatial Modelling for Data Scientists
  7. Transport Access Manual: A Guide for Measuring Connection between People and Places
  8. Essentials of Geographic Information Systems
  9. Interactive web-based data visualization with R, plotly, and shiny

Report/blog

  1. New Urban Agenda: New Urban Analytics

  2. Housing development: the economics of small sites – the effect of project size on the cost of housing construction, BCIS
  3. Delivering more homes and better places
  4. Predicting House Prices with Machine Learning
  5. Using R for Spatial Data Analysis
  6. House price calculator: Where can I afford to rent or buy?
  7. Modelling the distribution of mortgage debt
  8. IS THERE A BETTER WAY TO MEASURE HOUSING AFFORDABILITY?
  9. Planning for the future


Other

  1. Resources for PhD Students
  2. Glitch: Digital literacy
  3. What is a Flowchart
  4. 10 Amazing Windows Shortcuts
  5. Using Big Data to Solve Economic and Social Problems
  6. Supporting housing delivery and public service infrastructure
  7. Everyone should be able to access a safe and affordable home. Increasing housing supply is essential to creating a fairer, more affordable housing market and boosting productivity across the country.


Research scope

1.Spatial coverage

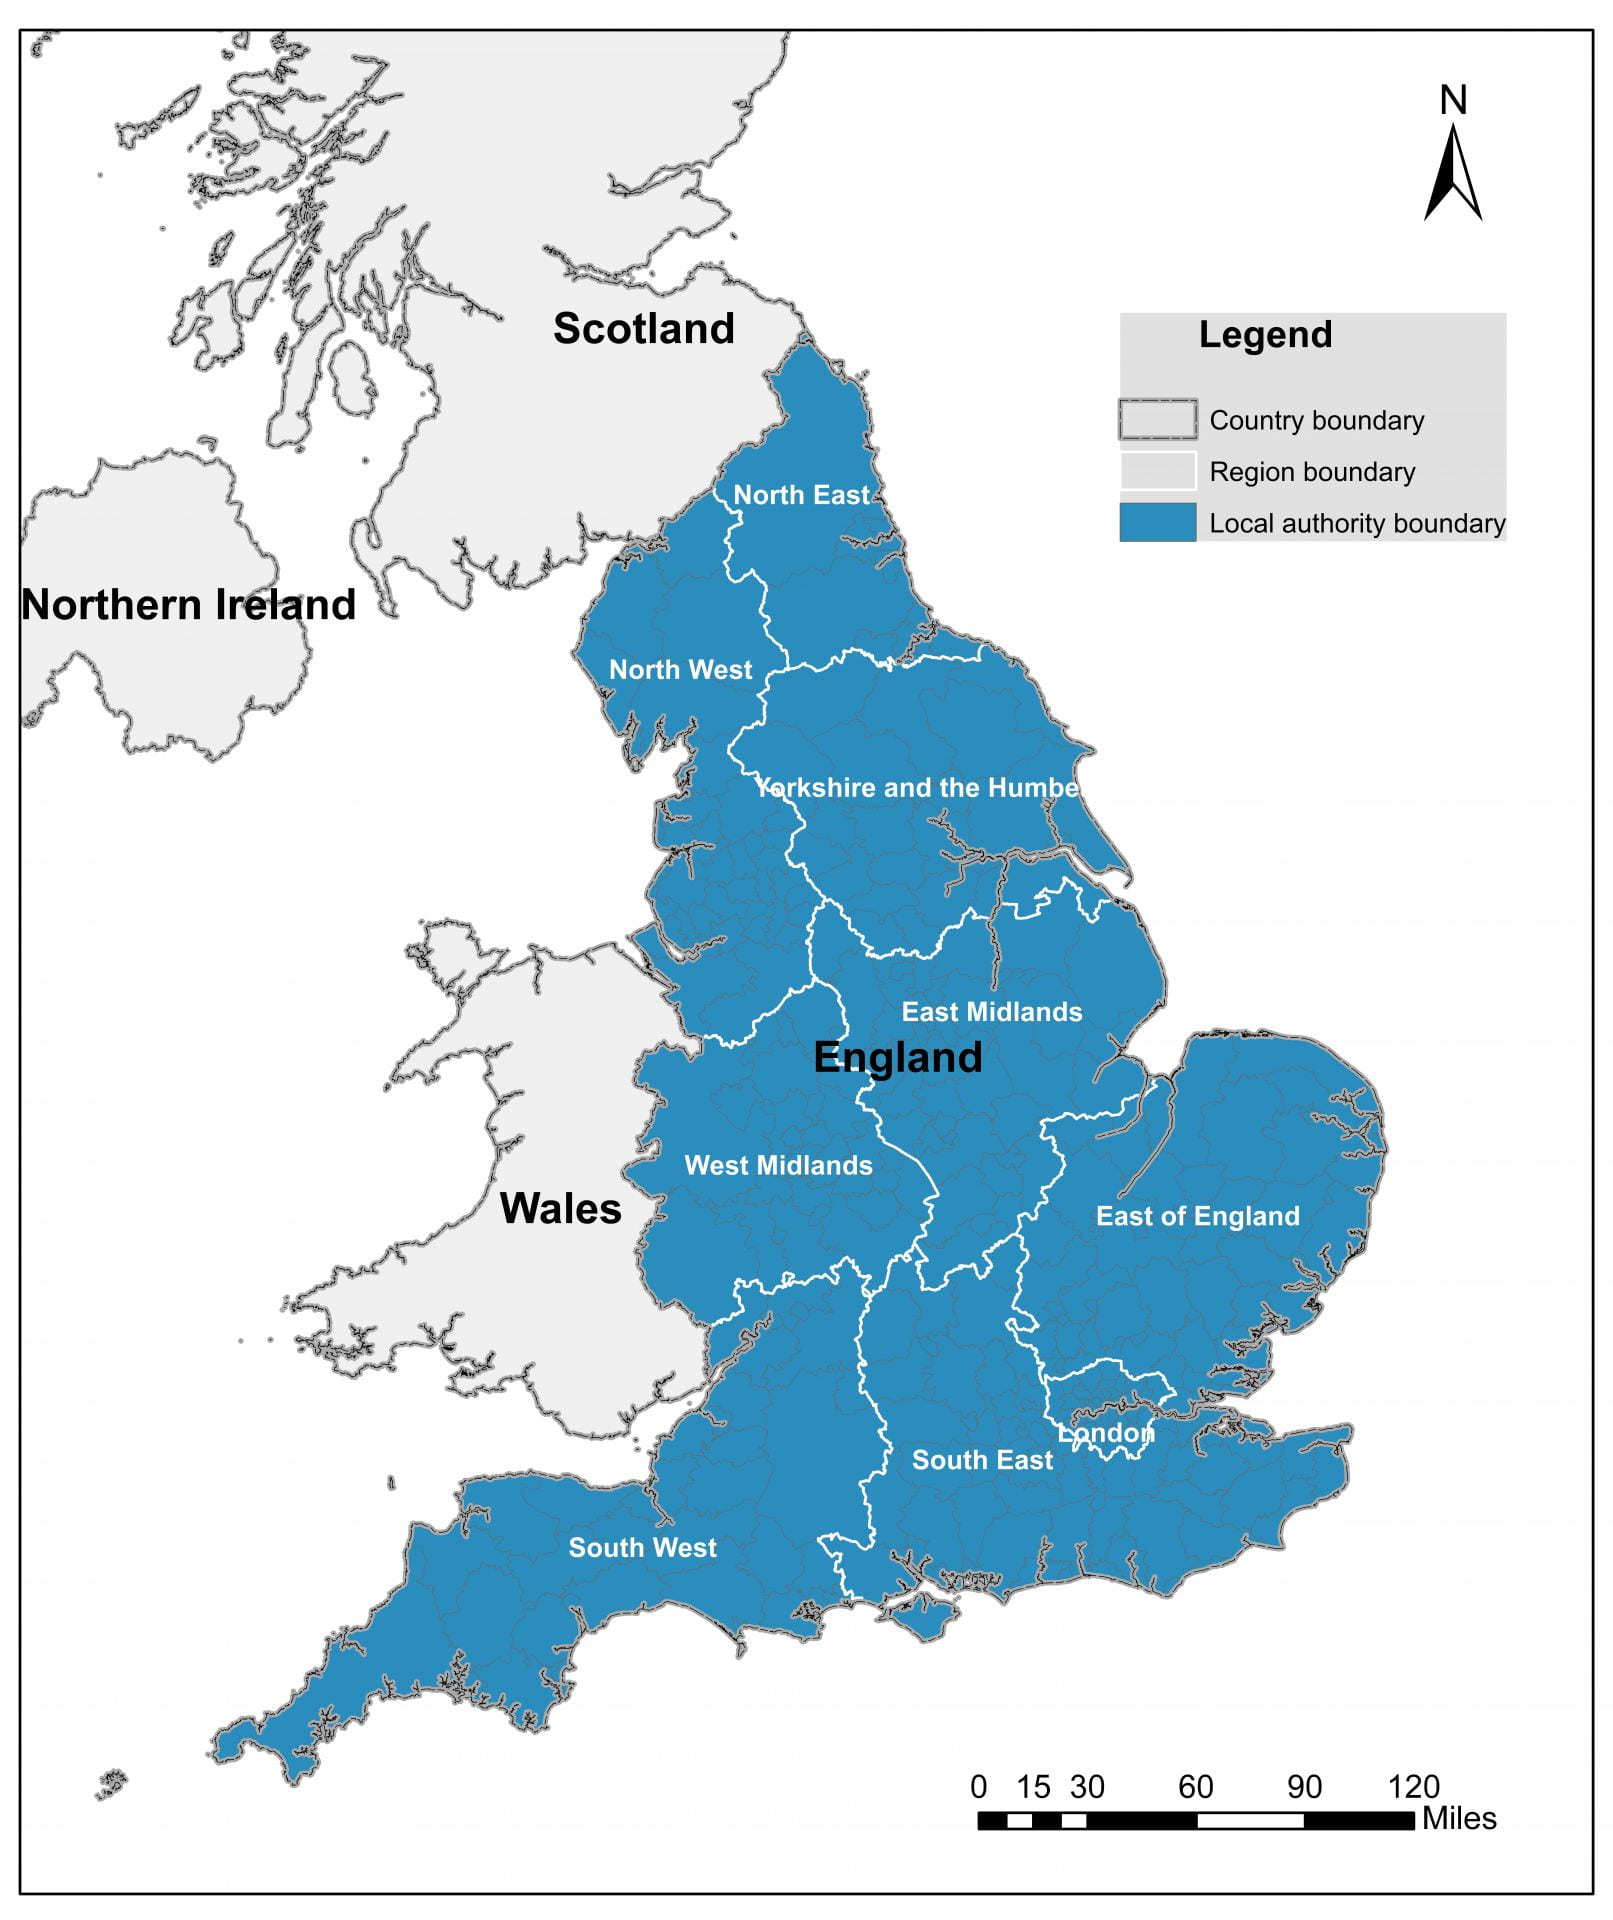
The study area is the whole of England, one of the countries of the United Kingdom. It contains nine regions: the North East, the North West, Yorkshire and the Humber, East Midlands, West Midlands, East of England, the South East, the South West and London. Administratively, England is divided into 326 local authority districts. The extent of the study area is presented in Figure 1.

Figure 1 The study area of this research

2.Time coverage

Limited by the time coverage of my new linked house price in England, my research focuses on the time period between 2009 and 2016.


Research data

1.Land Registry datasets

Transaction price, transaction date, property type.

Building plot

2.Ordnance Survey (OS) datasets

3.Ministry of Housing, Communities & Local Government (MHCLG) datasets

4. ONS Open Data

5. The Department for Work and Pensions (DWP) datasets

6.Other dataset


About

Hello! I am Bin Chi, a PhD researcher at The Bartlett Centre for Advanced Spatial Analysis (CASA), University College London. I have a background in both GIS and urban planning (Land Use Management), with a particular emphasis upon using statistical modelling and geographical analysis to investigate the spatio-temporal pattern of socio-economic processes to further guide local planning policy.

During my PhD research at UCL CASA, I have built up a consistent framework to coordinate and integrate analyses across different spatial and temporal scales of England’s residential house prices to advance understanding of the housing affordability issue. As my PhD is almost completed, the blog here is a brief summary of my research findings. All the blogs are a team effort, which has been supported by Adam, Thomas and Robin.

If you have any questions, please feel free to get in touch.